Datastory Maps: Turn Your Geographic Data into Insightful Stories
By Victoria Gladkiy • 10/15/2024
Learn how Datastory Maps transforms geographic data into compelling, interactive visualizations that tell powerful location-based stories.
At Datastory, we believe that geographic data holds the key to unlocking impactful insights. With Datastory Maps, your organization can transform raw, geographically relevant data into dynamic, interactive visualizations that tell compelling stories. Whether you're in the public sector, energy industry, or educational field, our platform allows you to present complex data in a clear, actionable format. Our tools empower decision-makers, researchers, and the public to explore and interact with geographic data in a way that increases understanding and drives informed decision-making.
What is an Interactive Map?
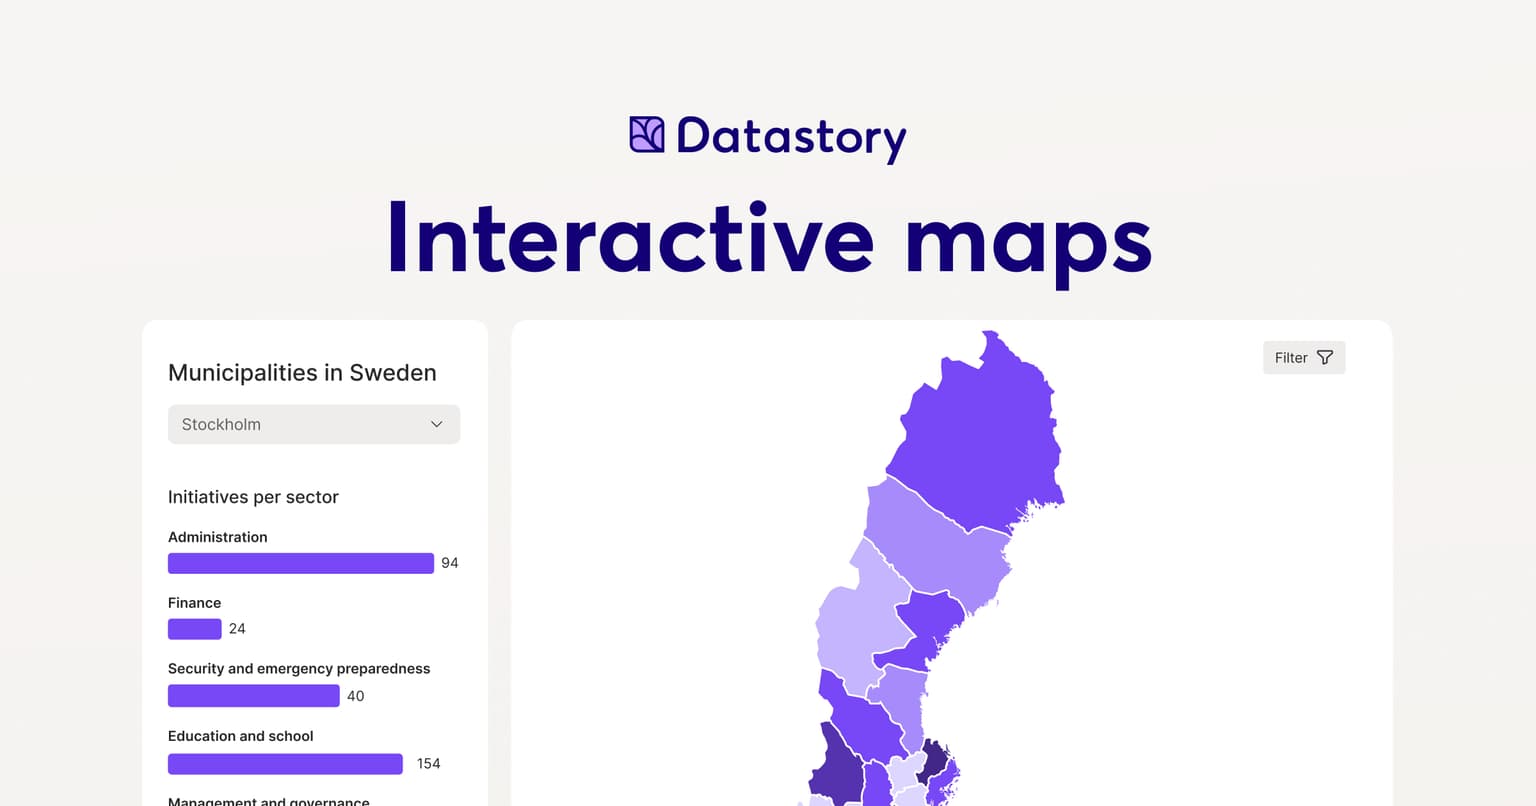
An interactive map is a dynamic tool that allows users to engage with geographic data in real-time. Unlike traditional maps, which present fixed information, interactive maps offer features such as zooming, filtering, and data layer exploration. They enable users to uncover insights by clicking on regions, analyzing specific data points, and interacting directly with the map, leading to a deeper understanding of the spatial relationships within the data. Interactive maps are invaluable for any organization looking to make data-driven decisions, as they allow stakeholders to visualize complex information in a way that is both intuitive and impactful.
Key Features of Datastory Maps
- Interactive Visualizations: With animated maps our platform provides a dynamic user experience that turns geographic data into actionable insights.
- Customizable Templates: Choose from a variety of map templates to match your specific needs. Whether you need detailed hexagonal grids for spatial analysis or simple, high-level visualizations, Datastory has the right tools.
- Real-Time Data Integration: Ensure your maps reflect the latest information with real-time data updates, allowing users to explore current trends and future forecasts.
- Advanced Spatial Analysis Tools: Utilize advanced features like hexagonal maps powered by Uber's H3 system to conduct in-depth spatial analysis and see patterns that might be missed on traditional maps.
- Easy-to-Use Interface: Our platform is designed for both technical and non-technical users, ensuring that everyone can easily navigate and interact with your geographic data.
Why Interactive Maps Outperform Static Maps
- Interactive Exploration vs. Fixed Views
Interactive maps let users zoom, click, and explore different regions, making it easy to dive deeper into the data. Static maps are limited to one view, offering no ability to explore beyond what's shown.
- Real-Time Updates vs. Outdated Information
With interactive maps, data is updated in real-time, ensuring users always see the latest information. Static maps quickly become outdated and require manual updates.
- Engaging Experience vs. Passive Viewing
Interactive maps invite users to actively explore data, making the experience more engaging and informative. Static maps provide a one-way, passive experience without interactivity.
- Multiple Data Layers vs. Single-Layer Information
Interactive maps can display multiple layers of information, allowing users to toggle between them for deeper insights. Static maps are limited to showing just one set of data.
- Custom Experience vs. Fixed Layout
Interactive maps allow users to personalize their experience by filtering data and exploring what's most relevant to them. Static maps present a fixed layout with no customization options.
SEO Benefits of Interactive Maps
Embedding interactive maps can boost your website's SEO by keeping visitors engaged longer, reducing bounce rates—an important factor for search engines like Google. Improved user experience through easy navigation and relevant information also contributes to better search rankings, helping your site attract more organic traffic.
In short, interactive maps not only showcase data effectively but also enhance your website's visibility and performance in search engines.
Success Stories
1. Behovskartan: Visualizing Sweden's Future Energy Needs
In collaboration with AI Sweden, Datastory developed Behovskartan, a powerful visualization tool that maps Sweden's current and future energy needs. The tool was designed to help AI Sweden overcome goal conflicts in the country's energy strategy and provide stakeholders with a comprehensive view of energy demand across key sectors such as industry, transportation, and households.
Key Features:
- Interactive Energy Demand Maps: Users can explore energy needs across different sectors, visualizing both current conditions and future projections.
- Hexagonal Map Structure: Powered by Uber's H3 system, these maps allow for detailed spatial analysis of energy distribution and demand, providing granular insights.
- Real-Time Data Integration: Data updates in real-time, ensuring that stakeholders always have the most current information for decision-making.
- User-Friendly Interface: Designed for both technical and non-technical users, the map provides a smooth and intuitive experience, enabling quick access to insights.
Explore Behovskartan here.
2. Skolkartan: Mapping Socio-Economic Disparities in Swedish Schools
In partnership with Berättarministeriet, Datastory created Skolkartan, a tool designed to map and analyze socio-economic disparities in schools across Sweden. The platform allows users to explore key metrics such as school performance, student-teacher ratios, and socio-economic conditions, helping to identify areas where educational resources are most needed.
Key Features:
- Comprehensive School Data: The map includes key metrics such as student-teacher ratios, school performance, and socio-economic conditions, offering a holistic view of each school's status.
- Interactive Exploration: Users can zoom into specific regions and schools to get detailed insights, making it easy to identify areas needing attention and resources.
- Customizable Views: The map allows users to filter and explore specific data points, ensuring tailored insights based on the user's needs.
Explore Skolkartan here.
Use Cases for Datastory Maps
Public Sector & NGOs
Turn geographic data into actionable insights for decision-makers, policymakers, and the public. Whether it's mapping energy needs or socio-economic disparities, Datastory Maps provide a dynamic, engaging platform to explore your data.
Research Institutions
Datastory Maps allow researchers to visualize and share their findings with interactive, geographic representations of their data, making complex patterns easier to understand and communicate.
Corporate & Financial Analysts
Engage stakeholders with interactive maps that showcase market trends, resource distribution, or infrastructure planning, providing deeper insights into geographically relevant data.
Why Datastory?
At Datastory, we help organizations turn data into meaningful stories. With Datastory Maps, we provide the tools and expertise to bring you geographical data to life, whether through dynamic visualizations, real-time updates, or customizable templates. Our platform is designed to make your data more accessible, actionable, and impactful.
Get Started with Datastory Maps Today
Are you ready to bring your geographic data to life? Contact us at Datastory and learn how our interactive mapping solutions can help you showcase your data in ways that drive real-world impact.