Data Explorers: Unlock the Full Potential of Your Dataset
By Victoria Gladkiy • 11/5/2024
Discover how Datastory's Data Explorers tool helps you unlock the full potential of your datasets, enabling flexible analysis and interactive exploration.
At Datastory, we know that data can tell countless stories—if you have the right tools to explore it. Data explorers provide a powerful way to uncover insights by allowing users to interact with complex datasets in an intuitive and meaningful way. Whether you're a researcher, policymaker, or data enthusiast, data explorers allow you to delve deeper into your data, offering a dynamic and customizable approach to viewing, filtering, and understanding key metrics.
What is a Data Explorer?
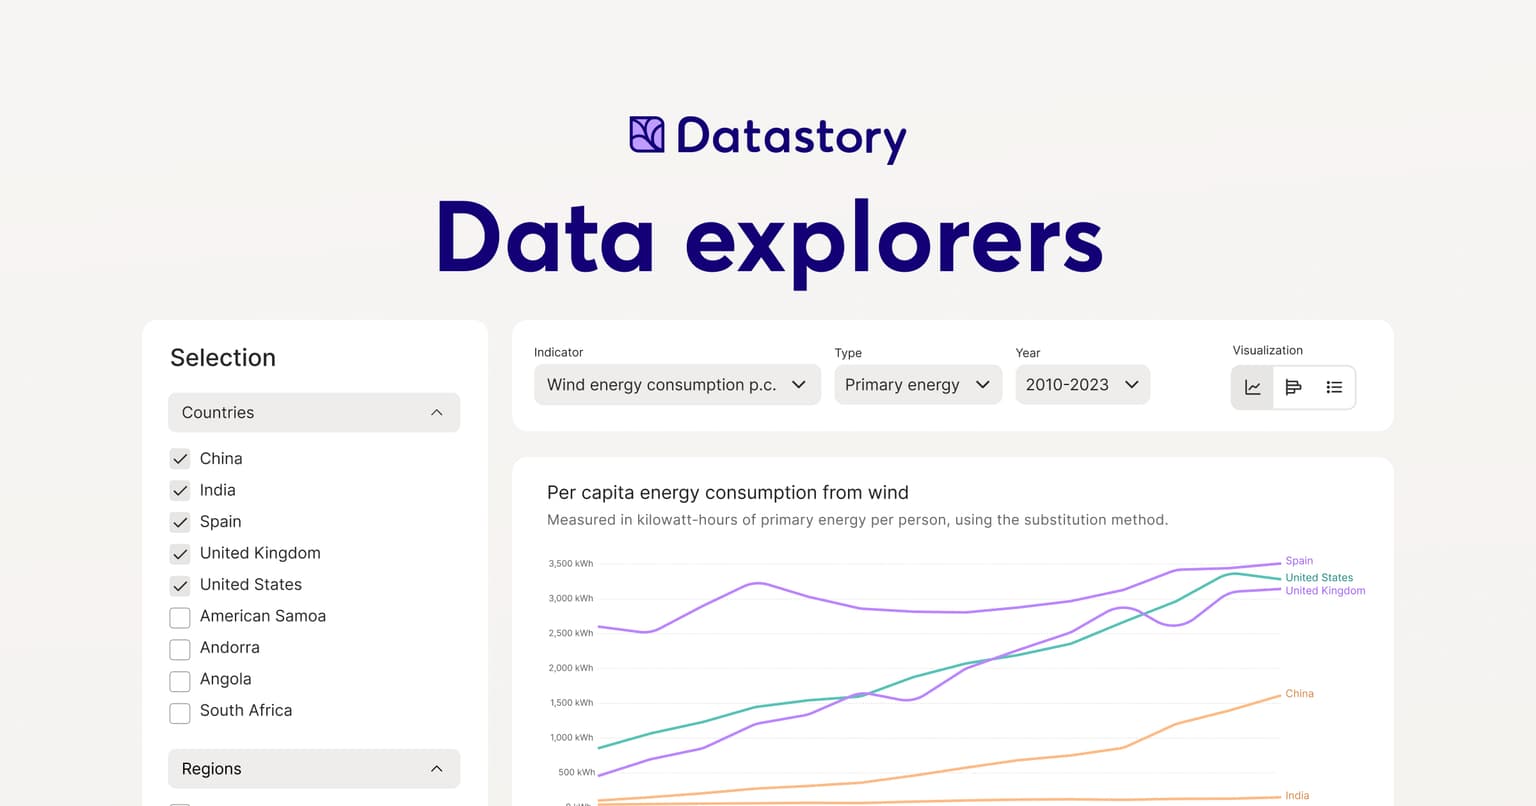
A Data Explorer is an interactive tool designed to let users explore and visualize data by selecting indicators and perspectives of interest. It allows you to:
- Choose Indicators: Select from a list of data points that are most relevant to your analysis—whether you're interested in population trends, economic indicators, or environmental data.
- View by Perspective: Tailor your view by selecting different perspectives, such as country, gender, income group, or time period, providing you with the flexibility to examine your data from multiple angles.
- Filter for Deeper Insights: Narrow down the dataset with custom filters that allow you to focus on specific regions, demographics, or time periods.
This ability to customize your exploration makes Data Explorers indispensable for anyone who needs to communicate data-driven insights to a broader audience.
Key Features of Datastory's Data Explorer
- Interactive Visualizations
Data Explorers offer dynamic, real-time visualizations, allowing users to see how different indicators and perspectives interact. With tools like charts, graphs, and maps, you can instantly see how your selections impact the dataset.
- Customizable Cubes
Our Data Explorers allow users to create "cubes"—specific data views that slice the dataset based on key perspectives such as country, sector, or demographic. Cubes help you focus on the metrics that matter most to your work.
- Multi-Layer Filtering
Get granular by applying multiple filters simultaneously. Whether you want to examine data trends by income group in specific regions, or compare changes across different time periods, the filtering capabilities allow for comprehensive analysis.
- Easy-to-Use Interface
Built for both technical and non-technical users, Datastory's Data Explorer provides a user-friendly interface that makes data exploration accessible to all, enabling you to visualize complex information without needing deep technical skills.
- Real-Time Data Integration
With real-time data updates, you can always rely on the most current information, ensuring that your insights reflect the latest trends and data points available.
What we're building right now
1. Empowering Access to Social Research Data
In collaboration with the SOM Institute at Gothenburg University, we're developing a Data Explorer that will transform how users engage with 37 years of social research. Since the indicators are embedded within SOM's publications, users are unable to explore the data directly. Our solution will offer a powerful, interactive platform that allows users—whether researchers, students, or the general public—to effortlessly explore, visualize, and export data. By integrating dynamic visualizations and filtering capabilities, we aim to make Swedish public opinion research more accessible and engaging than ever before.
2. Transforming Healthcare Data Insights
We're also developing a Healthcare Data Explorer in partnership with the Swedish Association of Local Authorities and Regions (Sveriges Kommuner och Regioner). This project will serve as a national dashboard that standardizes and visualizes key health data from various healthcare sources. By enabling decision-makers, medical professionals, and the general public to explore and analyze critical health data in real time, we're creating a tool that will provide actionable insights and a clearer understanding of healthcare trends across the country.
Why Choose a Data Explorer Over Static Data Views?
- Interactive vs. Static
While static data views give a snapshot in time, Data Explorers allow users to interact with the data. You can adjust perspectives, apply filters, and update visualizations instantly—transforming a passive data experience into an engaging exploration.
- Tailored Insights
Data Explorers enable users to customize their view based on the metrics that matter to them. By choosing specific indicators and perspectives, users can uncover hidden patterns and trends that static datasets often miss.
- Deeper Engagement
The interactive nature of Data Explorers encourages users to explore data further, fostering a deeper understanding of the insights. Instead of simply observing data, users become active participants in discovering the stories behind the numbers.
Use Cases for Data Explorers
- Research & Academia: Visualize and analyze research data in an interactive, intuitive format that makes it easier to identify key insights and share findings with a wider audience.
- Public Sector: Explore datasets related to population demographics, health, or economics to drive more informed policymaking and resource allocation.
- Corporate Analysts: Examine market trends, financial indicators, or customer data by customizing the views and filtering options to generate actionable business insights.
Why Datastory?
At Datastory, we believe that the true value of data lies in its ability to tell a story. With our Data Explorers, we provide the tools to bring your data to life—whether through interactive visualizations, real-time updates, or customizable perspectives. Our platform is designed to make data exploration easier, faster, and more impactful.
Get Started with Datastory's Data Explorer Today
Are you ready to uncover the full potential of your dataset? Contact us at Datastory and discover how our Data Explorer solutions can help you turn data into actionable insights.